Big Bag Filling
Monitor filling operations in real time and turn every completed fill into production data for quality, efficiency, consistency, rework and machine-performance analysis.
Track total filled weight, completed batches and currently active filling sessions.
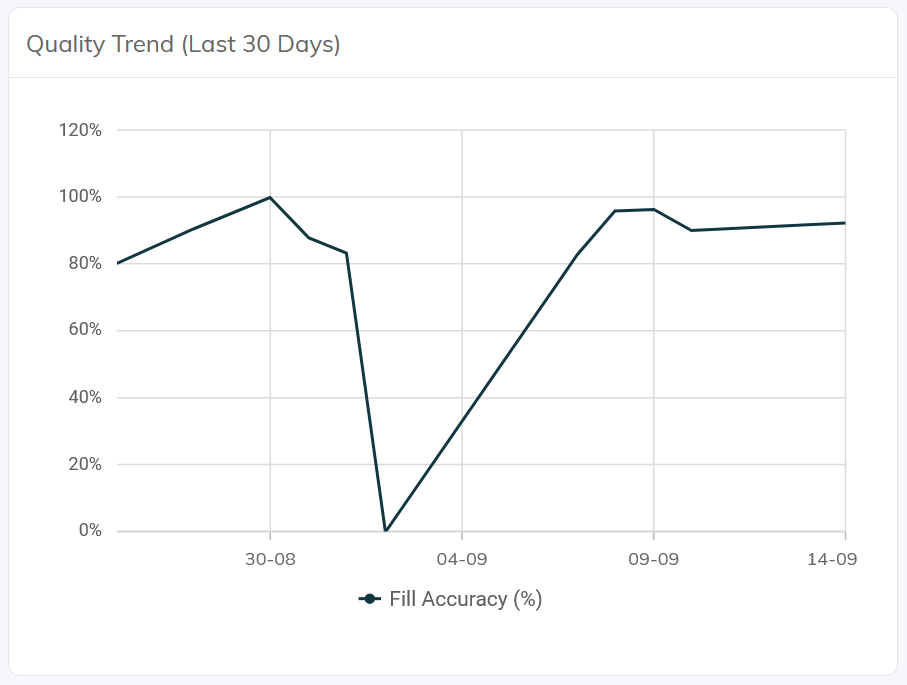
Measure fill accuracy, consistency and tolerance performance over time.
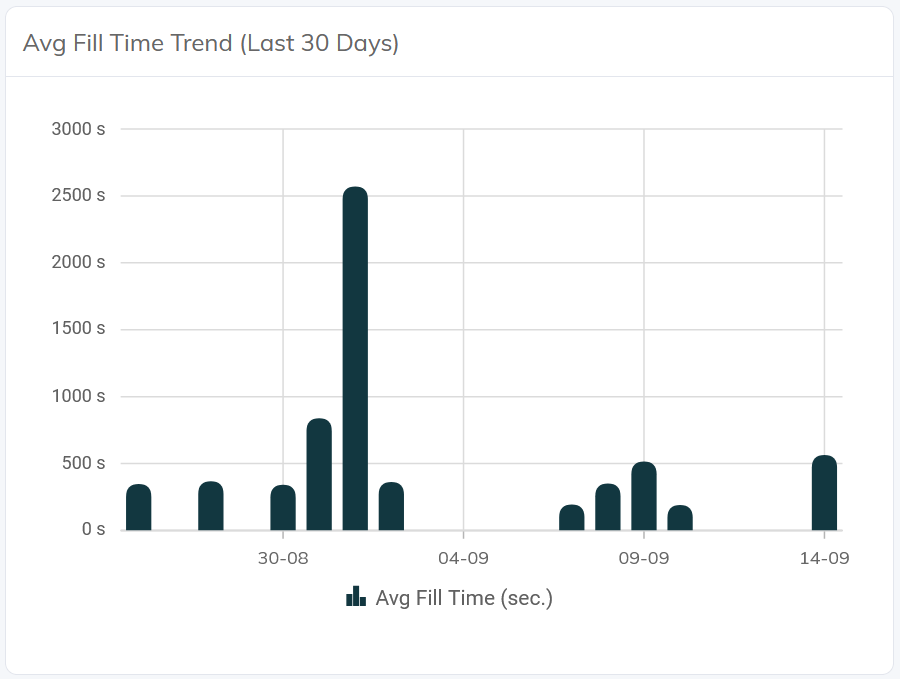
Analyse average fill time, rework and machine or station performance.
Filter transaction history by date, machine and status, then export the data.
See what is filling
right now
The dashboard combines current filling activity with the production totals needed to understand the day: filled weight, completed batches, active sessions and overall filling efficiency.
Accumulated filled product across the selected production day.
Completed filling transactions for the current day.
Filling stations currently running an active transaction.
Share of production operating within the configured filling tolerance.
Measure more than throughput
The module evaluates how accurately and consistently the filling process performs, not only how many kilograms were produced.
Track the percentage of completed fills that land within the configured tolerance around the target weight.
Follow the average time required to complete a filling cycle and compare it across days and filling stations.
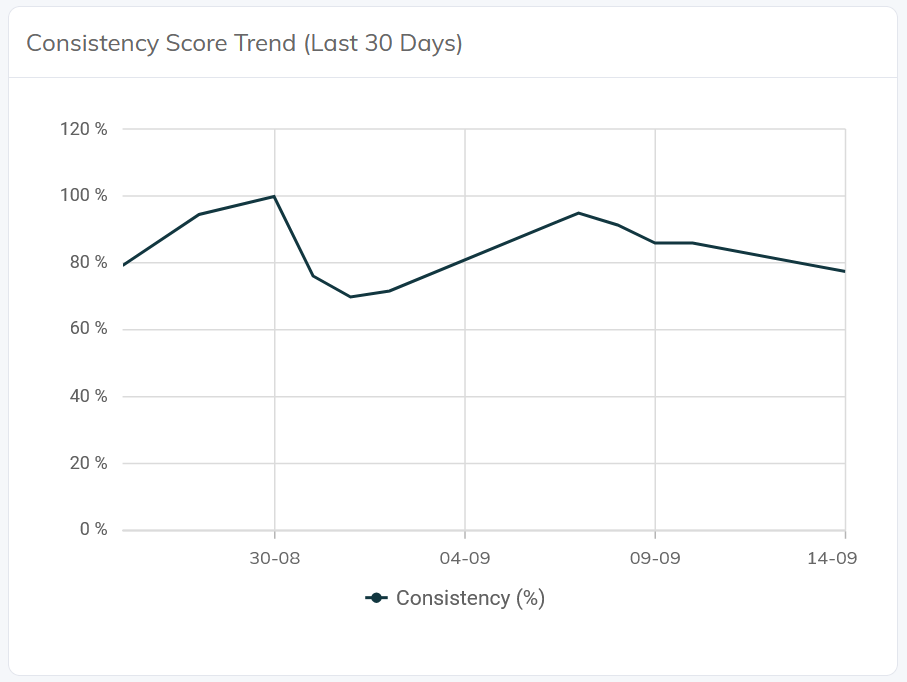
Use variation and standard deviation to understand how consistently the filling process repeats the desired result.
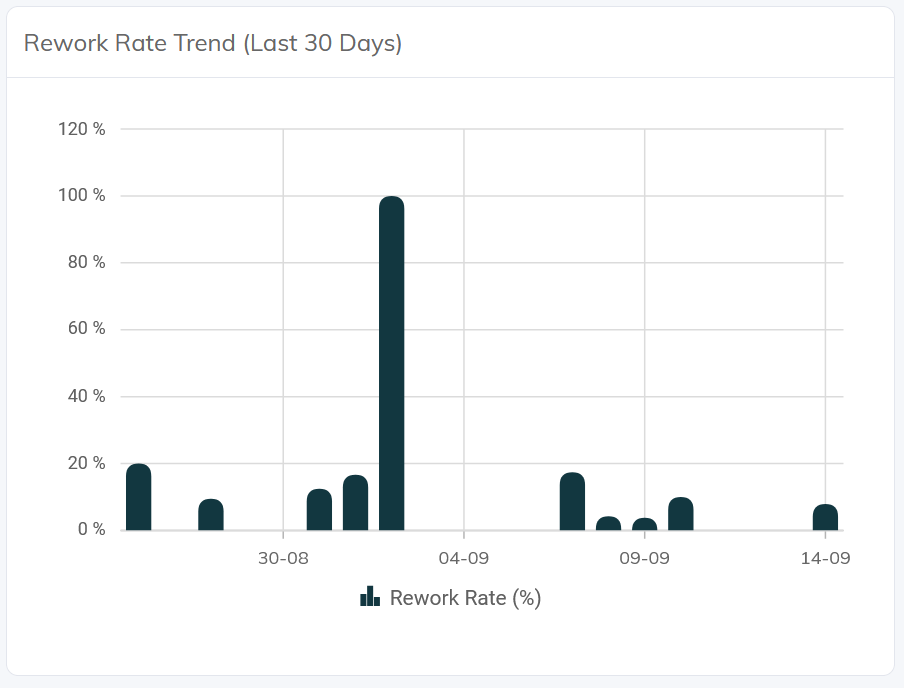
Track batches that require rework and monitor whether corrective filling is increasing or decreasing over time.
Watch quality and speed change over time
Thirty-day trends expose whether the process is becoming faster, more consistent and more accurate — or whether rework is starting to rise.
Daily and hourly output visibility
Review daily filled weight across the previous month and drill into hourly production for the current day to understand how output develops throughout a shift.
Compare how each filling station performs
Station-level analytics make it possible to compare production volume, fill quality and cycle performance instead of relying only on a plant-wide total.
Filter the history. Export the data
Transaction history can be filtered by date range, machine or station, and status. The resulting dataset can be exported to Excel for further production or quality analysis.
Every fill becomes production history
Filling transactions are stored as operational data in the Industrial Intelligence Platform. That allows the same production history to support station analysis, quality trends, reporting and wider line-level dashboards.
Improve output without losing quality visibility
Live production view
See filled weight, completed batches and active sessions during the production day.
Fill quality
Track accuracy and consistency instead of relying only on total throughput.
Cycle improvement
Use fill-time and rework trends to find opportunities for process improvement.
Traceable history
Retain station-level transactions and export filtered data for further analysis.
Turn every fill into production intelligence.
Connect filling stations, batch history, quality metrics and performance analytics through the Manomay Industrial Intelligence Platform.